

I redesigned Energy Justice Network’s map tool, visualizing the energy facilities in the United States and race.
>> View here
>> Check out the code on GitHub
Is there “dirty energy” in your backyard?
Context: Independent experiment
Time: 2 weeks
Team: Individual
Tools: D3.js, renderqueue.js, Leaflet.js
The challenge
I’ve become increasingly interested in the ways we visualize data for social change, especially at the grassroots level. When met Mike from Energy Justice Network several years ago, his concern was to visualize to faciitate communication and connection at the grassroots level.
Energy Justice Network (EJN) is a national support network for grassroots community groups fighting waste and dirty energy facilities.
As part of their mission, EJN compiles data about what type of facilities are operating and their impact on the surrounding communities. To communicate thier data to the public, EJN provides a mapping tool that visualizes all the energy facilities in the nation. Included in the map layers are race and income data.
The tool is both a vital public service and organizing tool, allowing any citizen to figure out which facilities are in their backyard. However, the tool’s design gets in the way of communicating this vital data.
When I encountered EJN mapping tool, I noted several problems that impeded my understanding of the data.
Problem 1: It’s Slow.
-
- Original version of the Energy Justice Network mapping tool. Notice the slow load time of data, and laggy response to interaction.
EJN maintains data of about 12,000 facilities. Loading the data takes several seconds, and the map is slow to respond to interaction.
Problem 2: It’s cluttered.
-
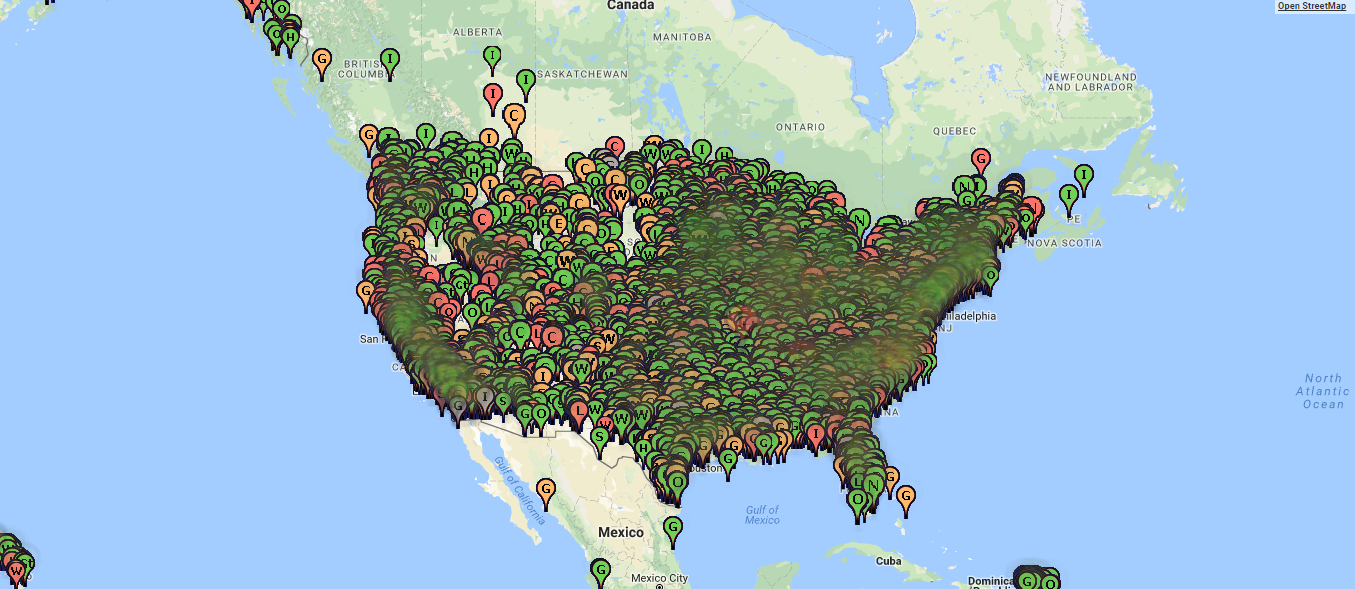
- Overlapping map markers
The facility markers on the map overlap and obscure each other. The demographic data, as encoded via colored counties, is hardly visible underneath.
Problem 3: Inflexible encoding of demographic layers
Several data layers, notably income and race, are loaded as map tile images. Map tiles take the form of static images; they aren’t easily editable. The map tiles and data are coupled together!
-
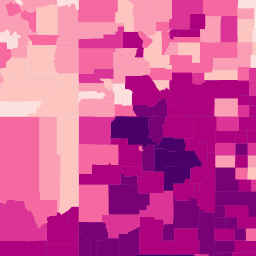
- A single map tile, with counties colored (encoded) by percentage of Hispanic residents
There are two problematic implications. First, encoding / coloring counties with multiple variables is nearly impossible. Second, the map itself is tied to a specific data set; its color can’t be changed. This is a massive issue, given the next problem.
Problem 4: The colorful map distracts from the data
“Make data stand out. Avoid superfluity.”
– William Cleveland, The elements of graphing data (1994)
-
- A very colorful map!
The colorful map distracts from the data, adding, in Edward Tufte’s terms, more non-data ink.
How could I design a model that addresses these issues, communicating the data in an effective way?
The data
First, I looked at the data. I scraped facility data from EJN’s mappng tool by figuring out what API calls were being used to retrieve the data.
(Their data is open source, and can be downloaded from their mapping website. I just wanted to practice scraping data.)
Each facility has these attributes:
- Name // String
- Location // [Latitude, Longitude]
- Type (of facility, such as nuclear) // String, Nominal (categorical)
I decided to use race (as a percentage per country) as a use case for visualizing demographic data in my model.
Each datum for the race data includes:
- GEO_ID (the government’s unique id for each county in the country // String, Nominal
- Race // String, Nominal
- Percentage race in county // Percentage, Quantitative
Finally, I headed over to the government’s resources to retrieve county boundaries for all 50 states. These took the format of GEOJSON and can be mapped using tools like Leaflet.
I was able to quickly map and color counties by percentage of race:
I was sort of surprised to find that if I used a color scale from 0 to 100% of one race, it was harder to visualize races that weren’t white:
-
- Comparing the density of the Asian demographic to the whole. It’s hard to discern the concentration of Asian populations.
A design decision needed to be made: compare concentrations of minorities to the dominant racial group (white people) or to themselves (i.e., where do most Asian-identified people live?).
Furthermore, should I only allow users to view race data one category at a time, or all at once? I went with the latter option, to both invite people to explore the impact of facilities on individual groups and to prevent adding clutter with another color palette.
The greater challenge was visualizing the facility data.
The solution
Solution 1: efficiency
My most ambitious goal of the project was to visualize the entire dataset of 12,000 energy facilities on one (Leaflet.js) map. A quick test of mapping the data using the Leaflet.js (svg-based) markers revealed a speed bottleneck. The browser doesn’t like a lot of SVG elements in the browser, and performance suffers.
-
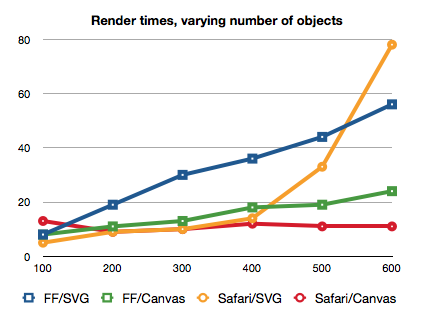
- Performance of SVG versus Canvas in different browsers. By Boris Smus
Canvas, on the other hand, can render more objects than SVG without losing as much speed.
However, figuring out how to make canvas jive with leaflet was a challenge. After some trial and error, I figured out that I could insert a canvas layer within the div that Leaflet.js uses to render a map:
<div class="leaflet-pane leaflet-map-pane">
<div>Map layer</div>
...
<canvas></canvas>
</div>
I was able to draw each facility using Leaflet’s latLngToContainerPoint method. To add further efficiency to the render, I only processed data within view.
Despite using canvas, rendering was still too slow. The browser was not immediately responsive.
Thankfully, I had another trick up my rendering sleeve: queing up the data to be rendered, allowing the browser to render data at its own speed.
Kai Chang created an awesome bit of code, renderqueue, that facilitates this process in JavaScript. using queuing, the browser remains responsive no matter how much data you throw at it!
The only downside to queuing is that data visibly and obviously disappears and reappears as it’s rendered. Given the trade off between aesthetics and responsiveness, the latter won this time.
Solution 2: Concise encoding
The obvious solution to a crowded map is decreasing the size of the map’s markers. For the EJN map, I used small circles instead of teardrop icons to mark the locations of facilities:
-
- Nice, bright data / stars on a dark background
-
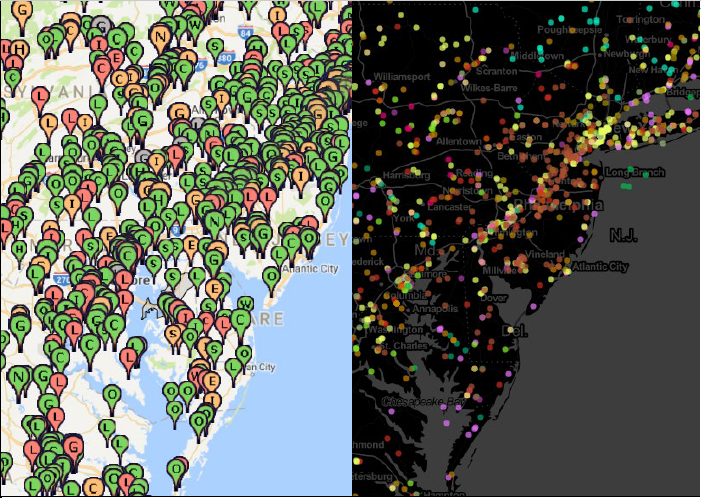
- Old visualization tool (left) and updated design (right)
The EJN map encoded facility type (gas, nuclear, etc.) with letters, which necessitated the larger markers. Instead, I opted to encode facility type with color. According to empirical work by Mackinlay (1986), color is the (second) easiest way for people to perceive categories (nominal data) effectively:
-
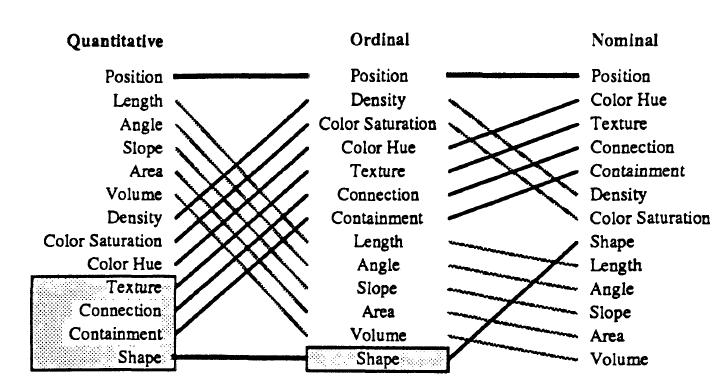
- Mackinlay’s empirically validated ranking of perceptual tasks (1986), an extension of the work by Cleveland and McGill (1984).
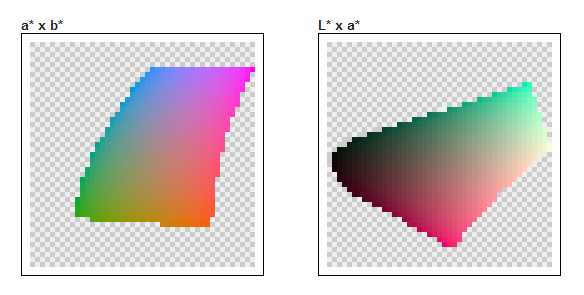
A major challenge with using color to visualize / encode categorical data is using colors that are sufficiently visually distinct. In the past, I’ve used the popular tool rColorBrewer to create color palettes:
-
- nominal / categorical color scales in rcolorbrewer
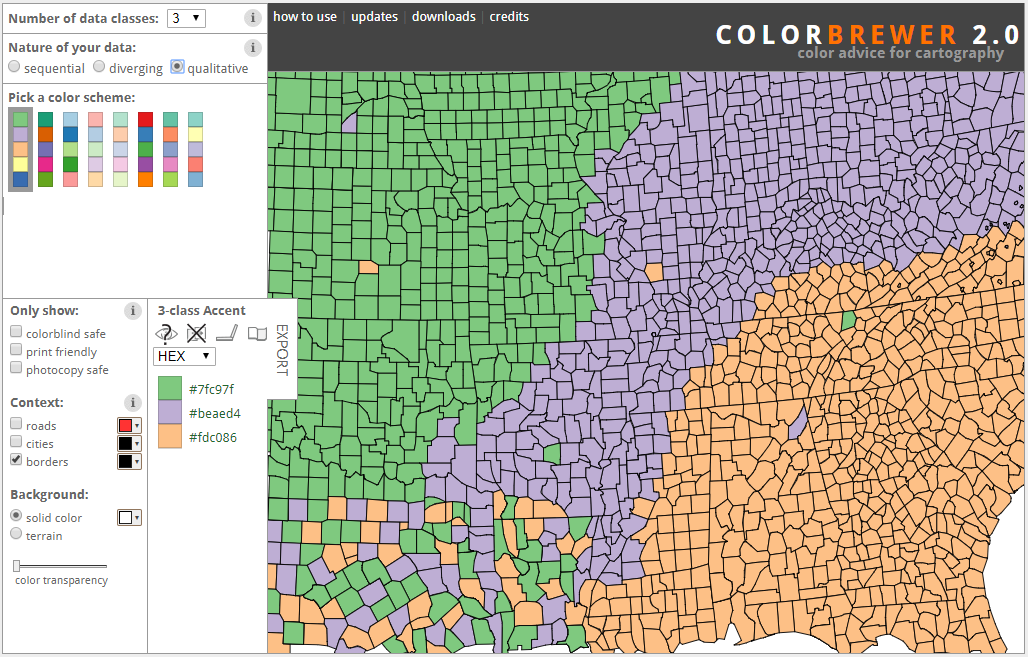
However, I craved a way to validate that my color choices were as perceptually distinct as they could be. Enter iWantHue, a tool that generates color palettes based on the CIE L*a*b* color space:
-
- The CIE L*a*b* color space, via iWantHue.com
The CIE L*a*b* color space is intended to be perceptually uniform. So, if the colors in a palette are equidistant in the CIE L*a*b* color space, they are maximally distinct. Hooray!
-
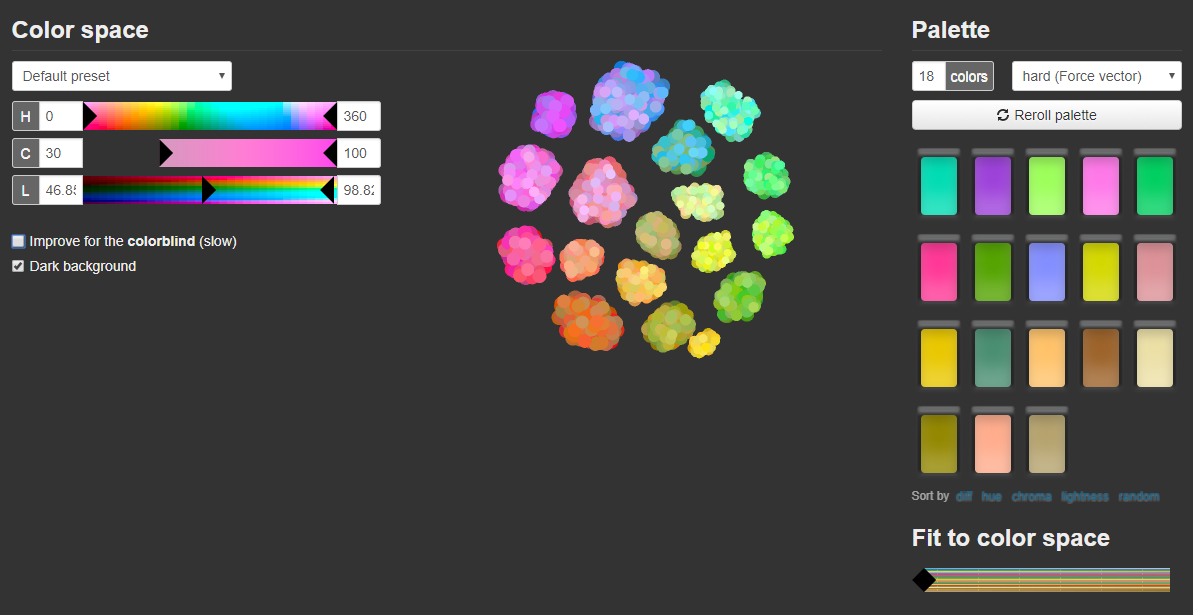
- Generating 18 distinct colors using iWantHue
Using iWantHue, I generated a palette of 18 distinct colors. That’s a lot of categories, but the colors are (mostly) discernible from one another for people with normative distributions of retinal cones.
-
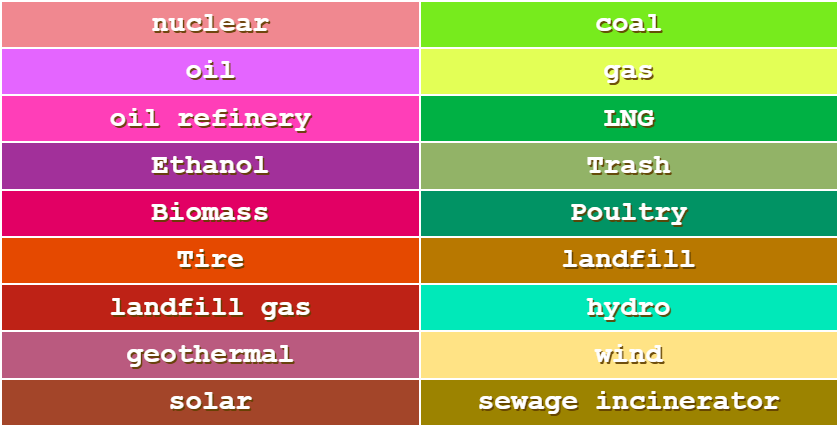
- Palette generated for each facility type using iWantHue.com
Solution 3: Minimal mappage
Like stars, bright colors stand out in a dark environment.
In the same vein, a dark map should make the data stand out. I’ve become taken with Stamen’s Toner map, although I disliked its white coloring for land.
-
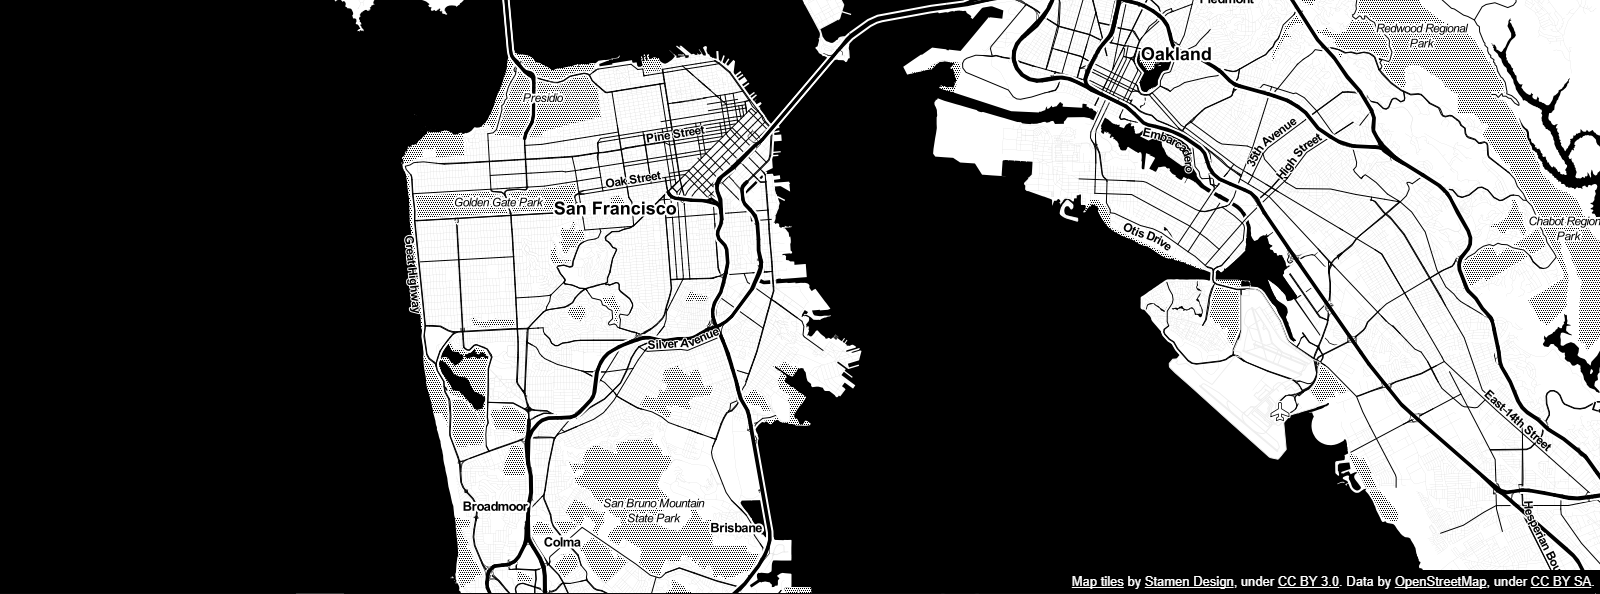
- Stamen Toner map tile set
I discovered, with a couple CSS3 modifications, I could invert the colors on the tiles and lower their opacity. Bright colors have maximum contrast on a black background:
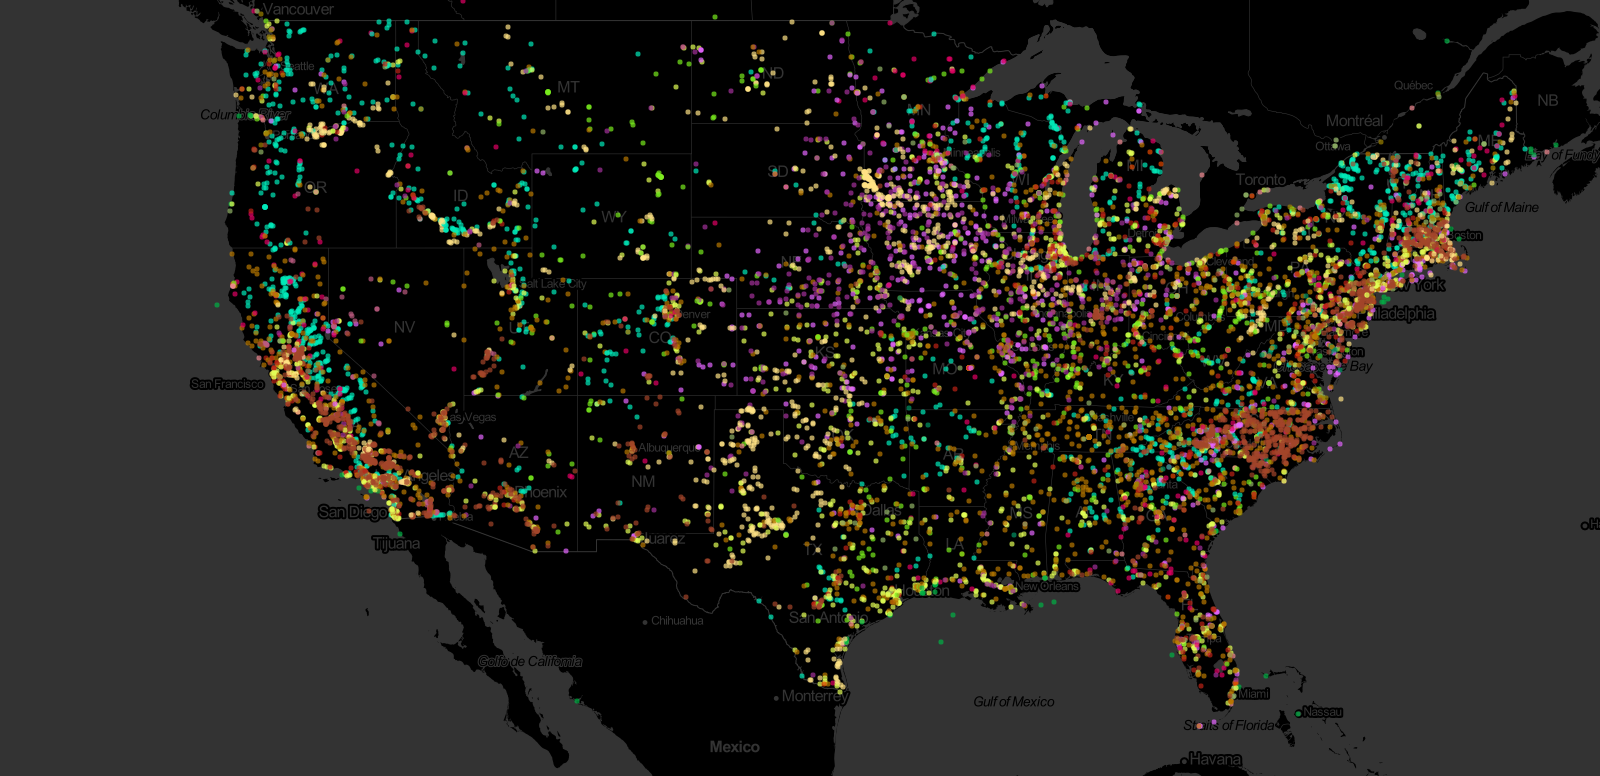
-
- Nice, bright data / stars on a dark background
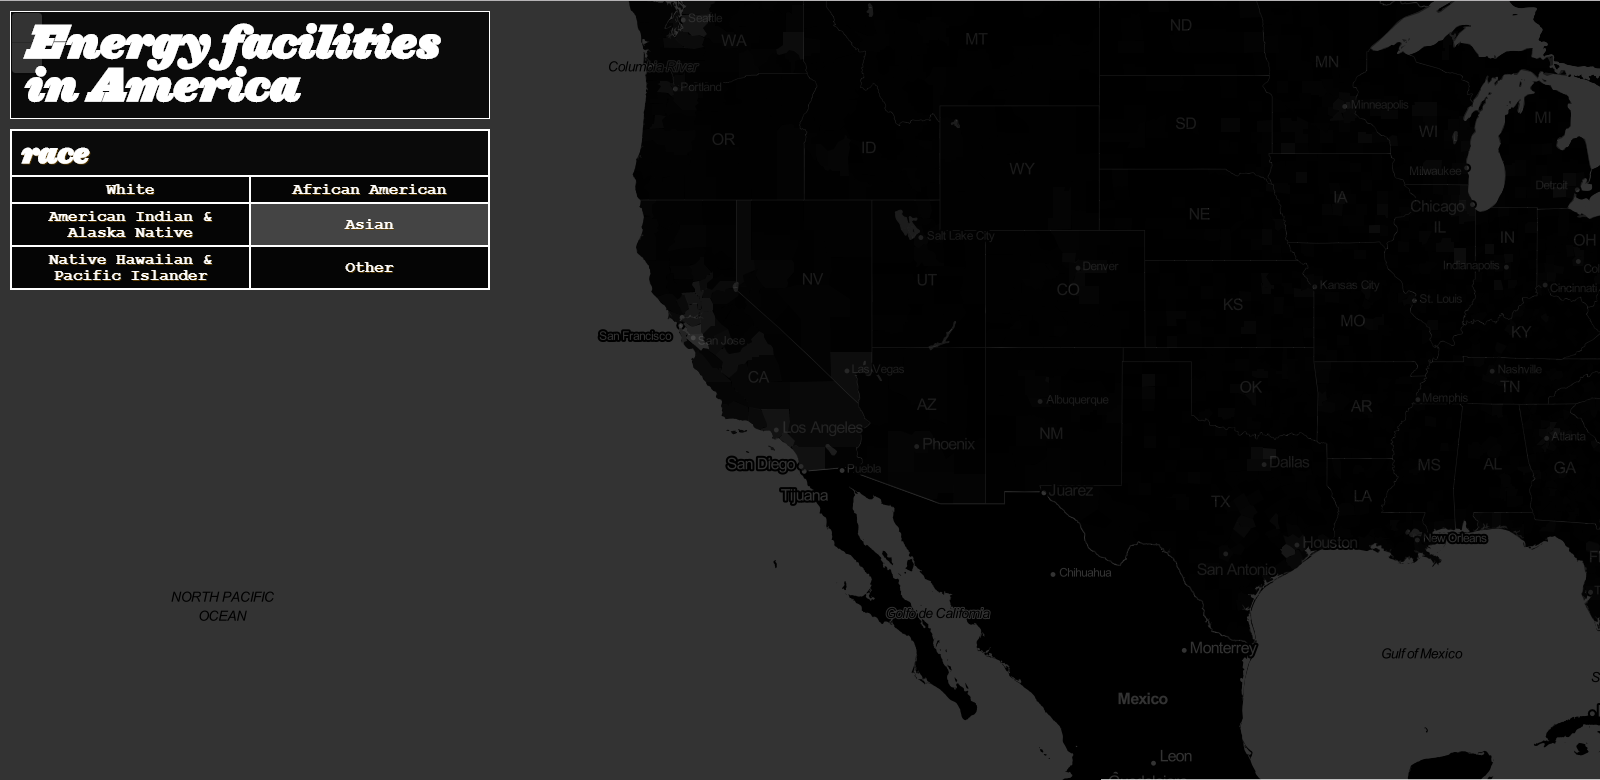
-
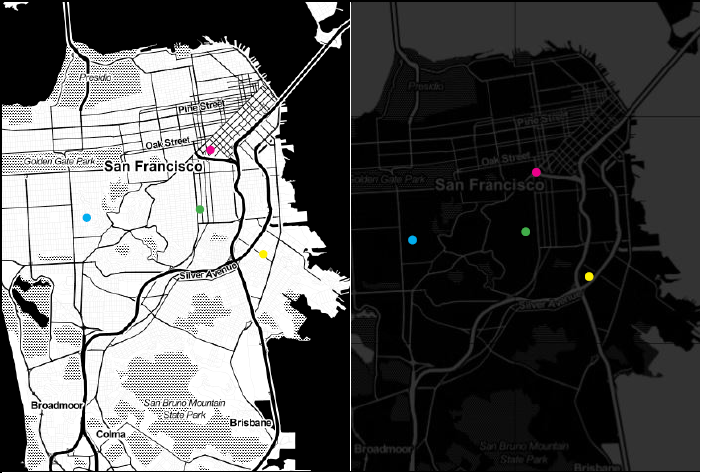
- Colored dots on map before (left) and after dark redesign (right)
Concluding thoughts
In the end, I was left with a model to visualize energy facilities and demographic data that solved EJN’s major design issues of responsiveness and clutter:
Redesigning the Energy Justice Network’s mapping tool proved a challenge, particularly in rendering. The complexity of this visualization challenge belies the depth of their data. More profoundly, working with this data revealed the nuance of addressing environmental racism and the scale of other problems.
Leveraging datasets to enact social change requires addressing this nuance in the data, specifically with regard to which variables one chooses to prioritize. For example, McKinlay’s ranking of perceptual tasks only provides for 2-3 ideal ways of encoding data, but which do we prioritize if we need to encode 20 variables?
Furthermore, my decision to visualize race at the county level over other data could have implications. For now, my visualization model only accounts for one kind of demographic, but will it be able to reconcile the addition of more?
A ripe avenue for exploration is addessing how to encode two variables via color. EJN provides county-level data for a variety of demographics and more, but their current tool only allows viewing one at a time. It’d be awesome for users to be able to see correlations of this data at the county level, such as emissions vs income level. I explore encoding two variables at once in my gentrification project.