

Have a shortage in creativity? Need to practice data visualization but all of your ideas are thesis-sized? I sure do.
This November, I’ll be tackling these problems by creating one-off, kind of silly, data visualizations every day.
The rules
- Design a data visualization, following a suggested prompt below or creating your own. Can be doodled or designed in any platform.
- Don’t overthink it. Be as weird as you’d like. In fact, I suggest timing yourself for 30 minutes from start to finished visualization.
- Tweet your viz using #VizVember.
Prompts for each day
- Dysfunction
- Pumpkin spice
- Sandwiches
- Candy
- Daylight savings time
- Fingernails
- Time spent doing things
- Cappucino
- Ears (Microtia Awareness Day)
- Cupcakes
- Coffee mugs
- Showers
- Kindness
- Pickles
- What’s in your refrigerator (National Clean Out Your Refrigerator Day)
- Buttons
- Spills
- Stuffed animals
- Capitalism
- Things that are absurd
- Throwing away garbage
- Housework
- Relatives
- Excessive consumption
- Blase’
- Miniatures
- Packages,boxes, and bags
- Toast
- Muscles
- Glasses
Happy visualizing!
Results
-
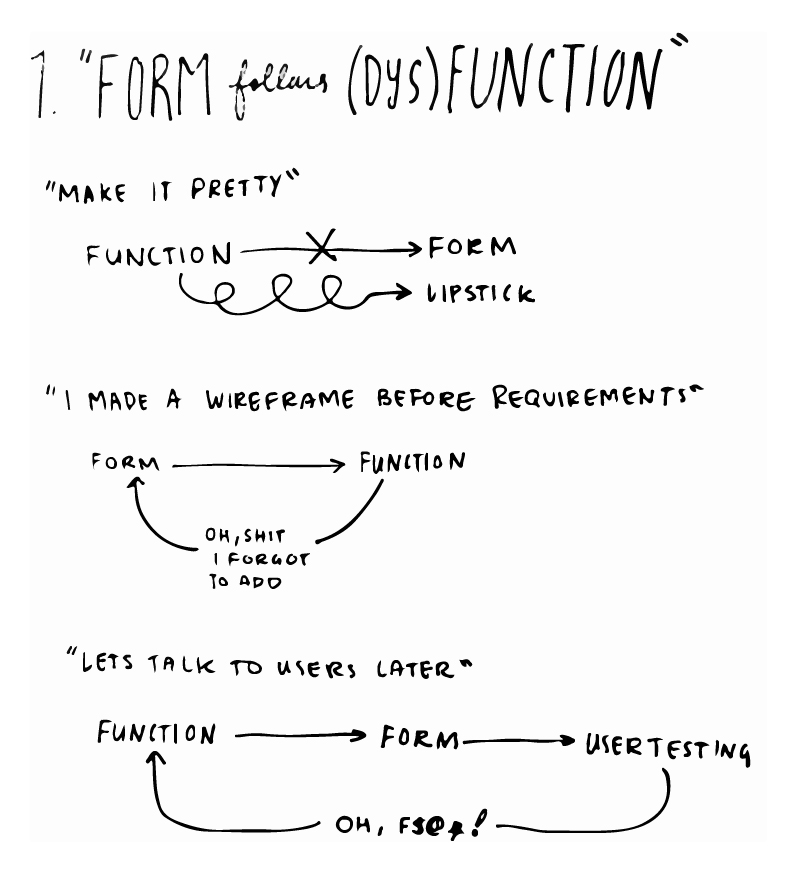
- 1. Form follows (dys)function
-
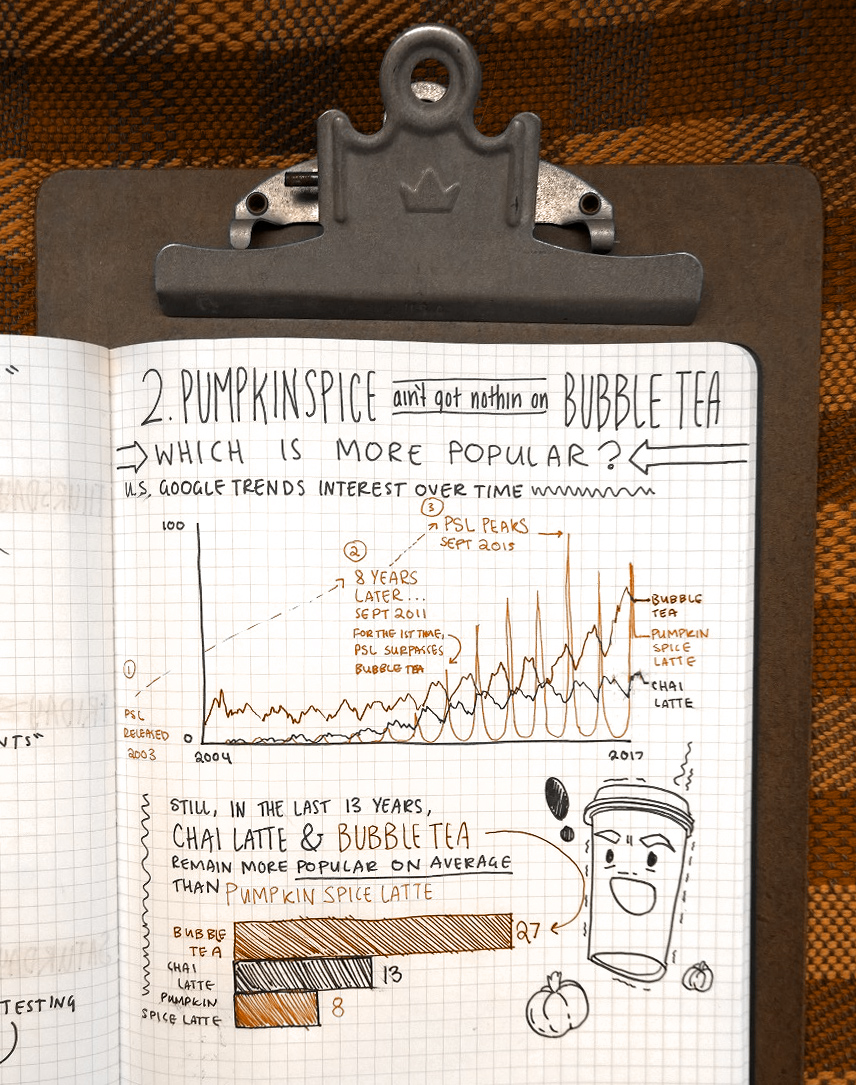
- 2. Pumpkin spice
-

- 3. Sandwiches
-
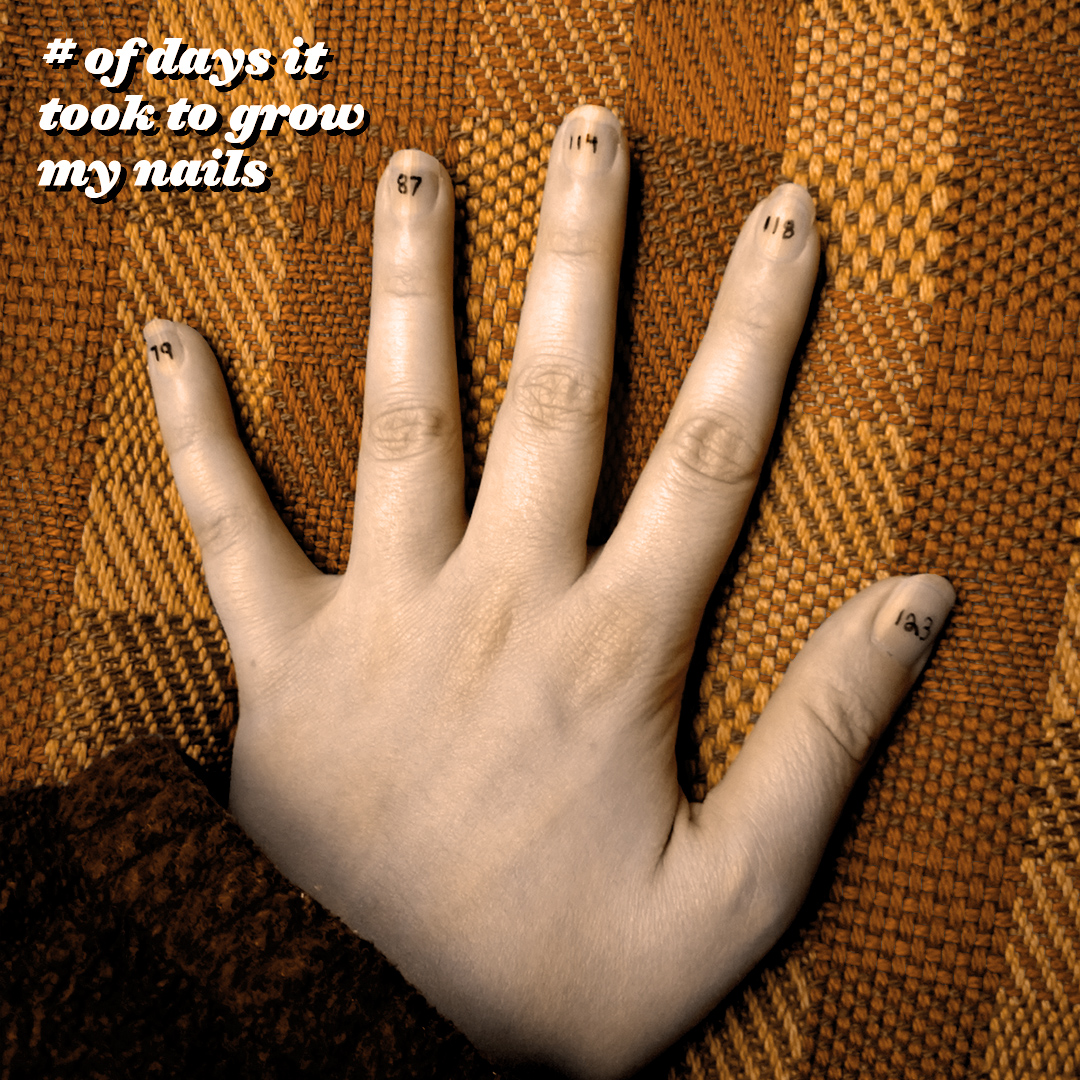
- 6. Nails (as a unit of time)
-
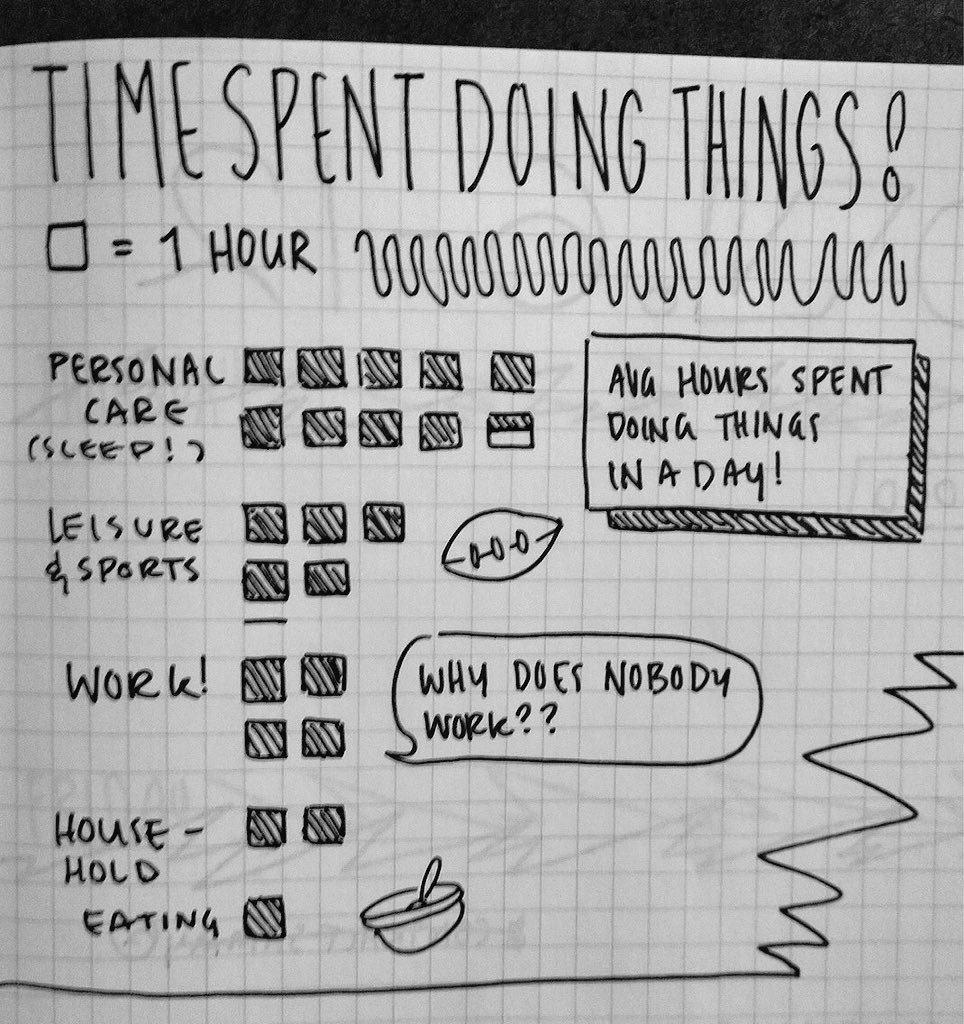
- 7. Time spent doing things
-
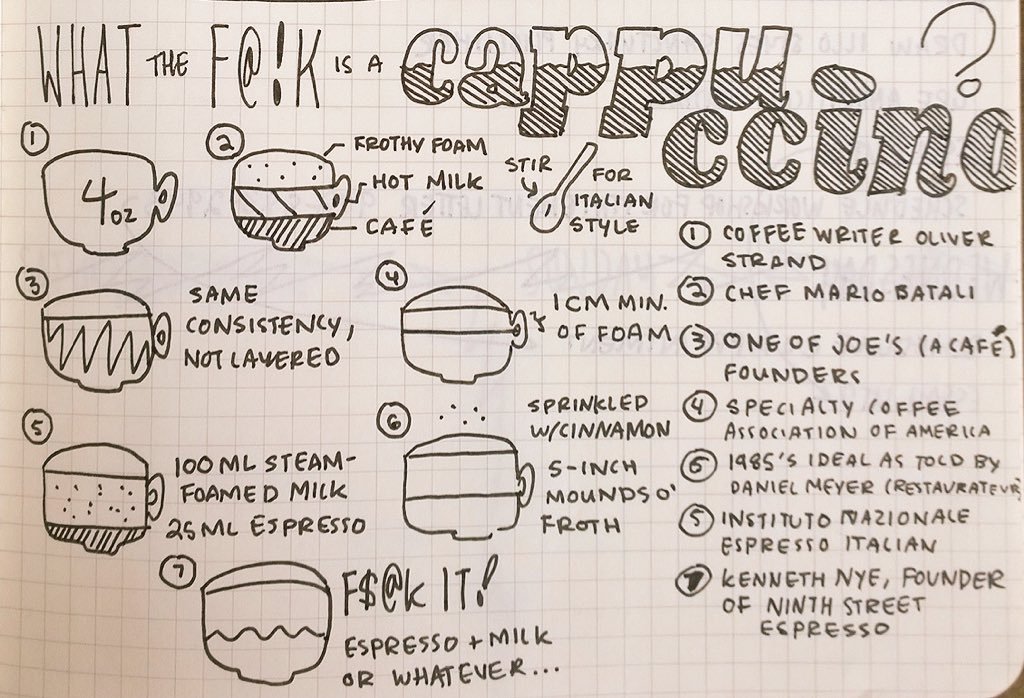
- 8. Cappucino
-
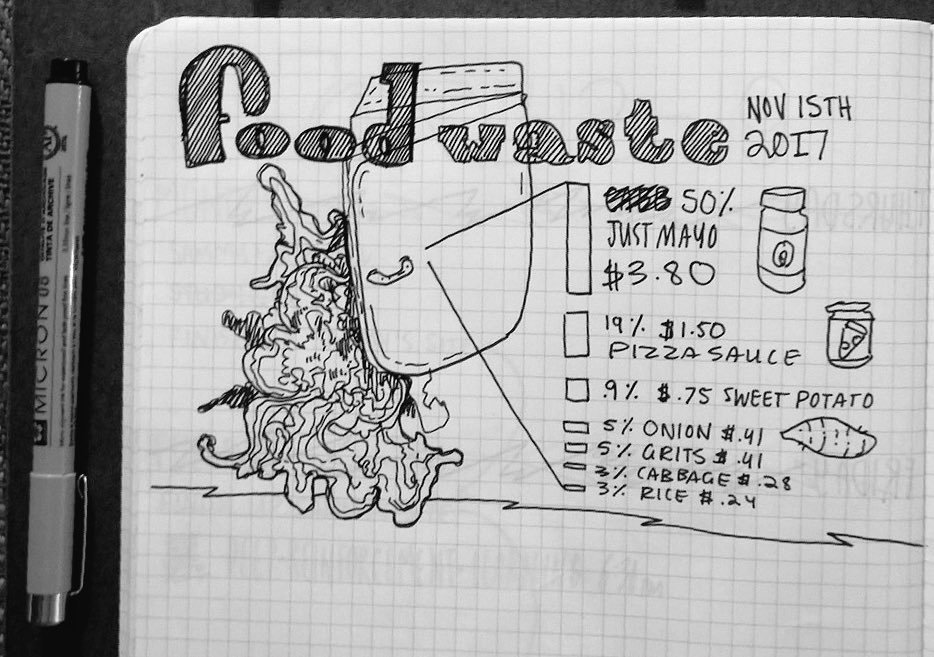
- 15. What’s in your refrigerator (National Clean Out Your Refrigerator Day)
-
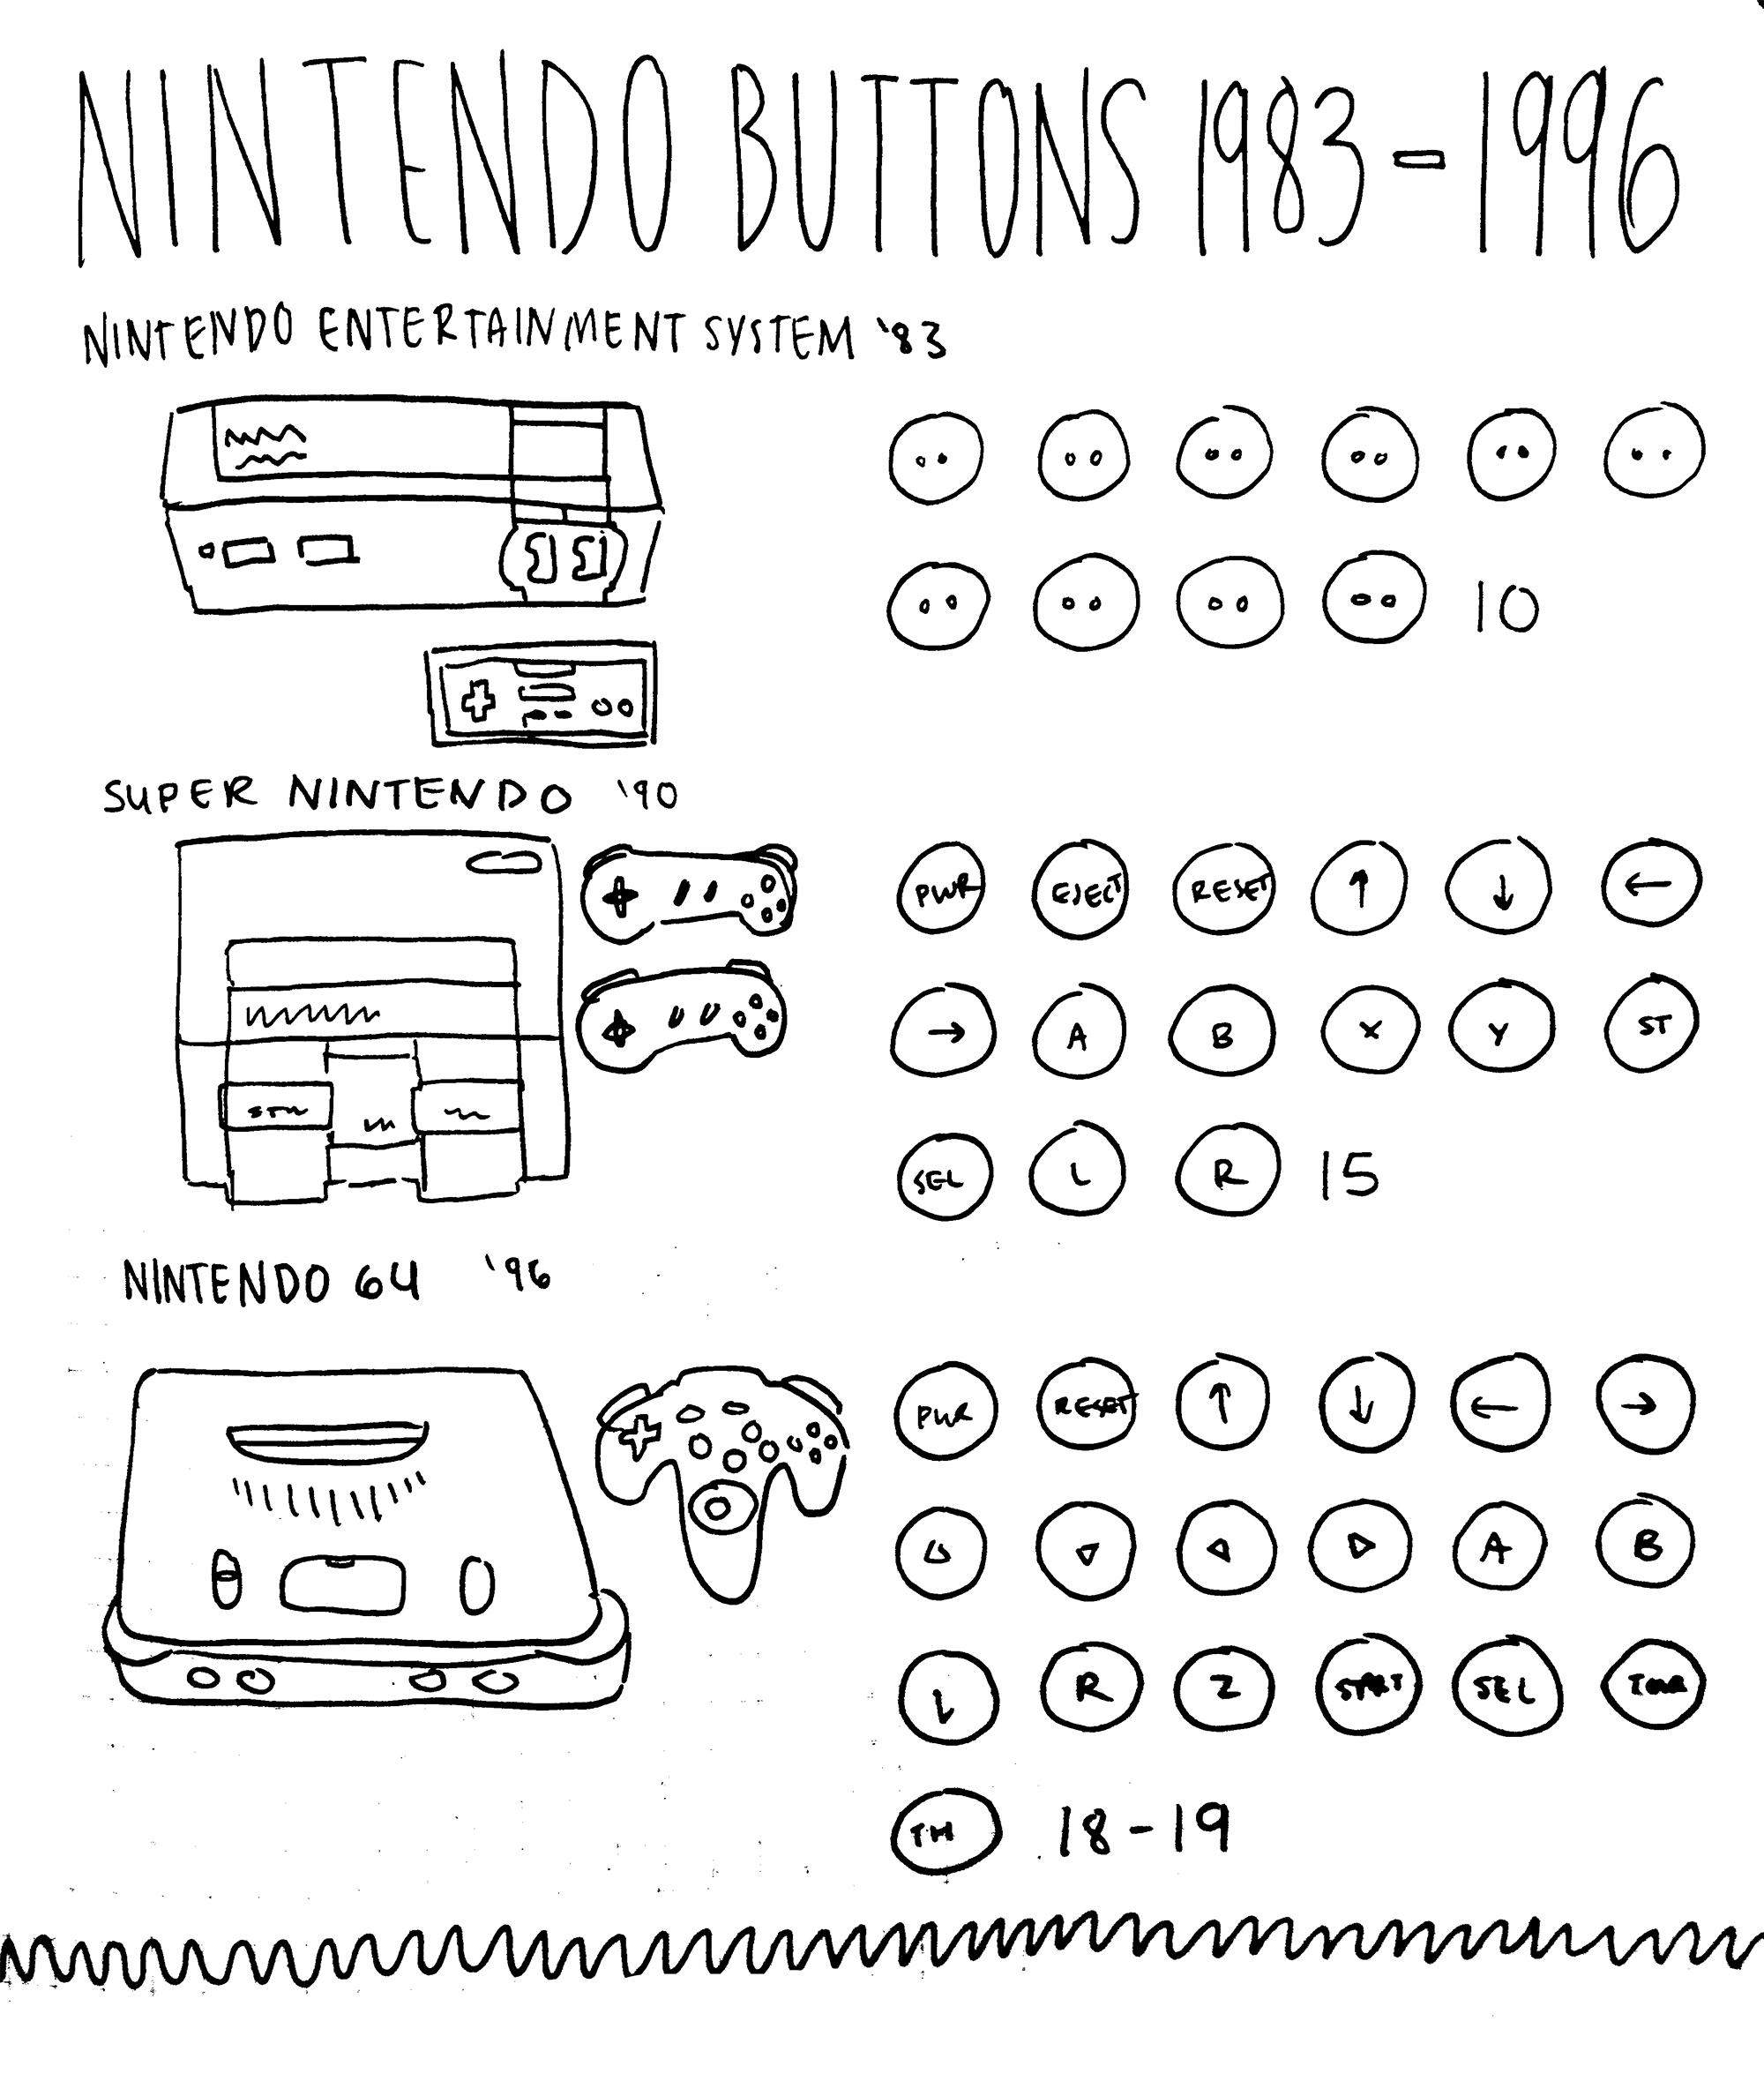
- 16. Buttons
-
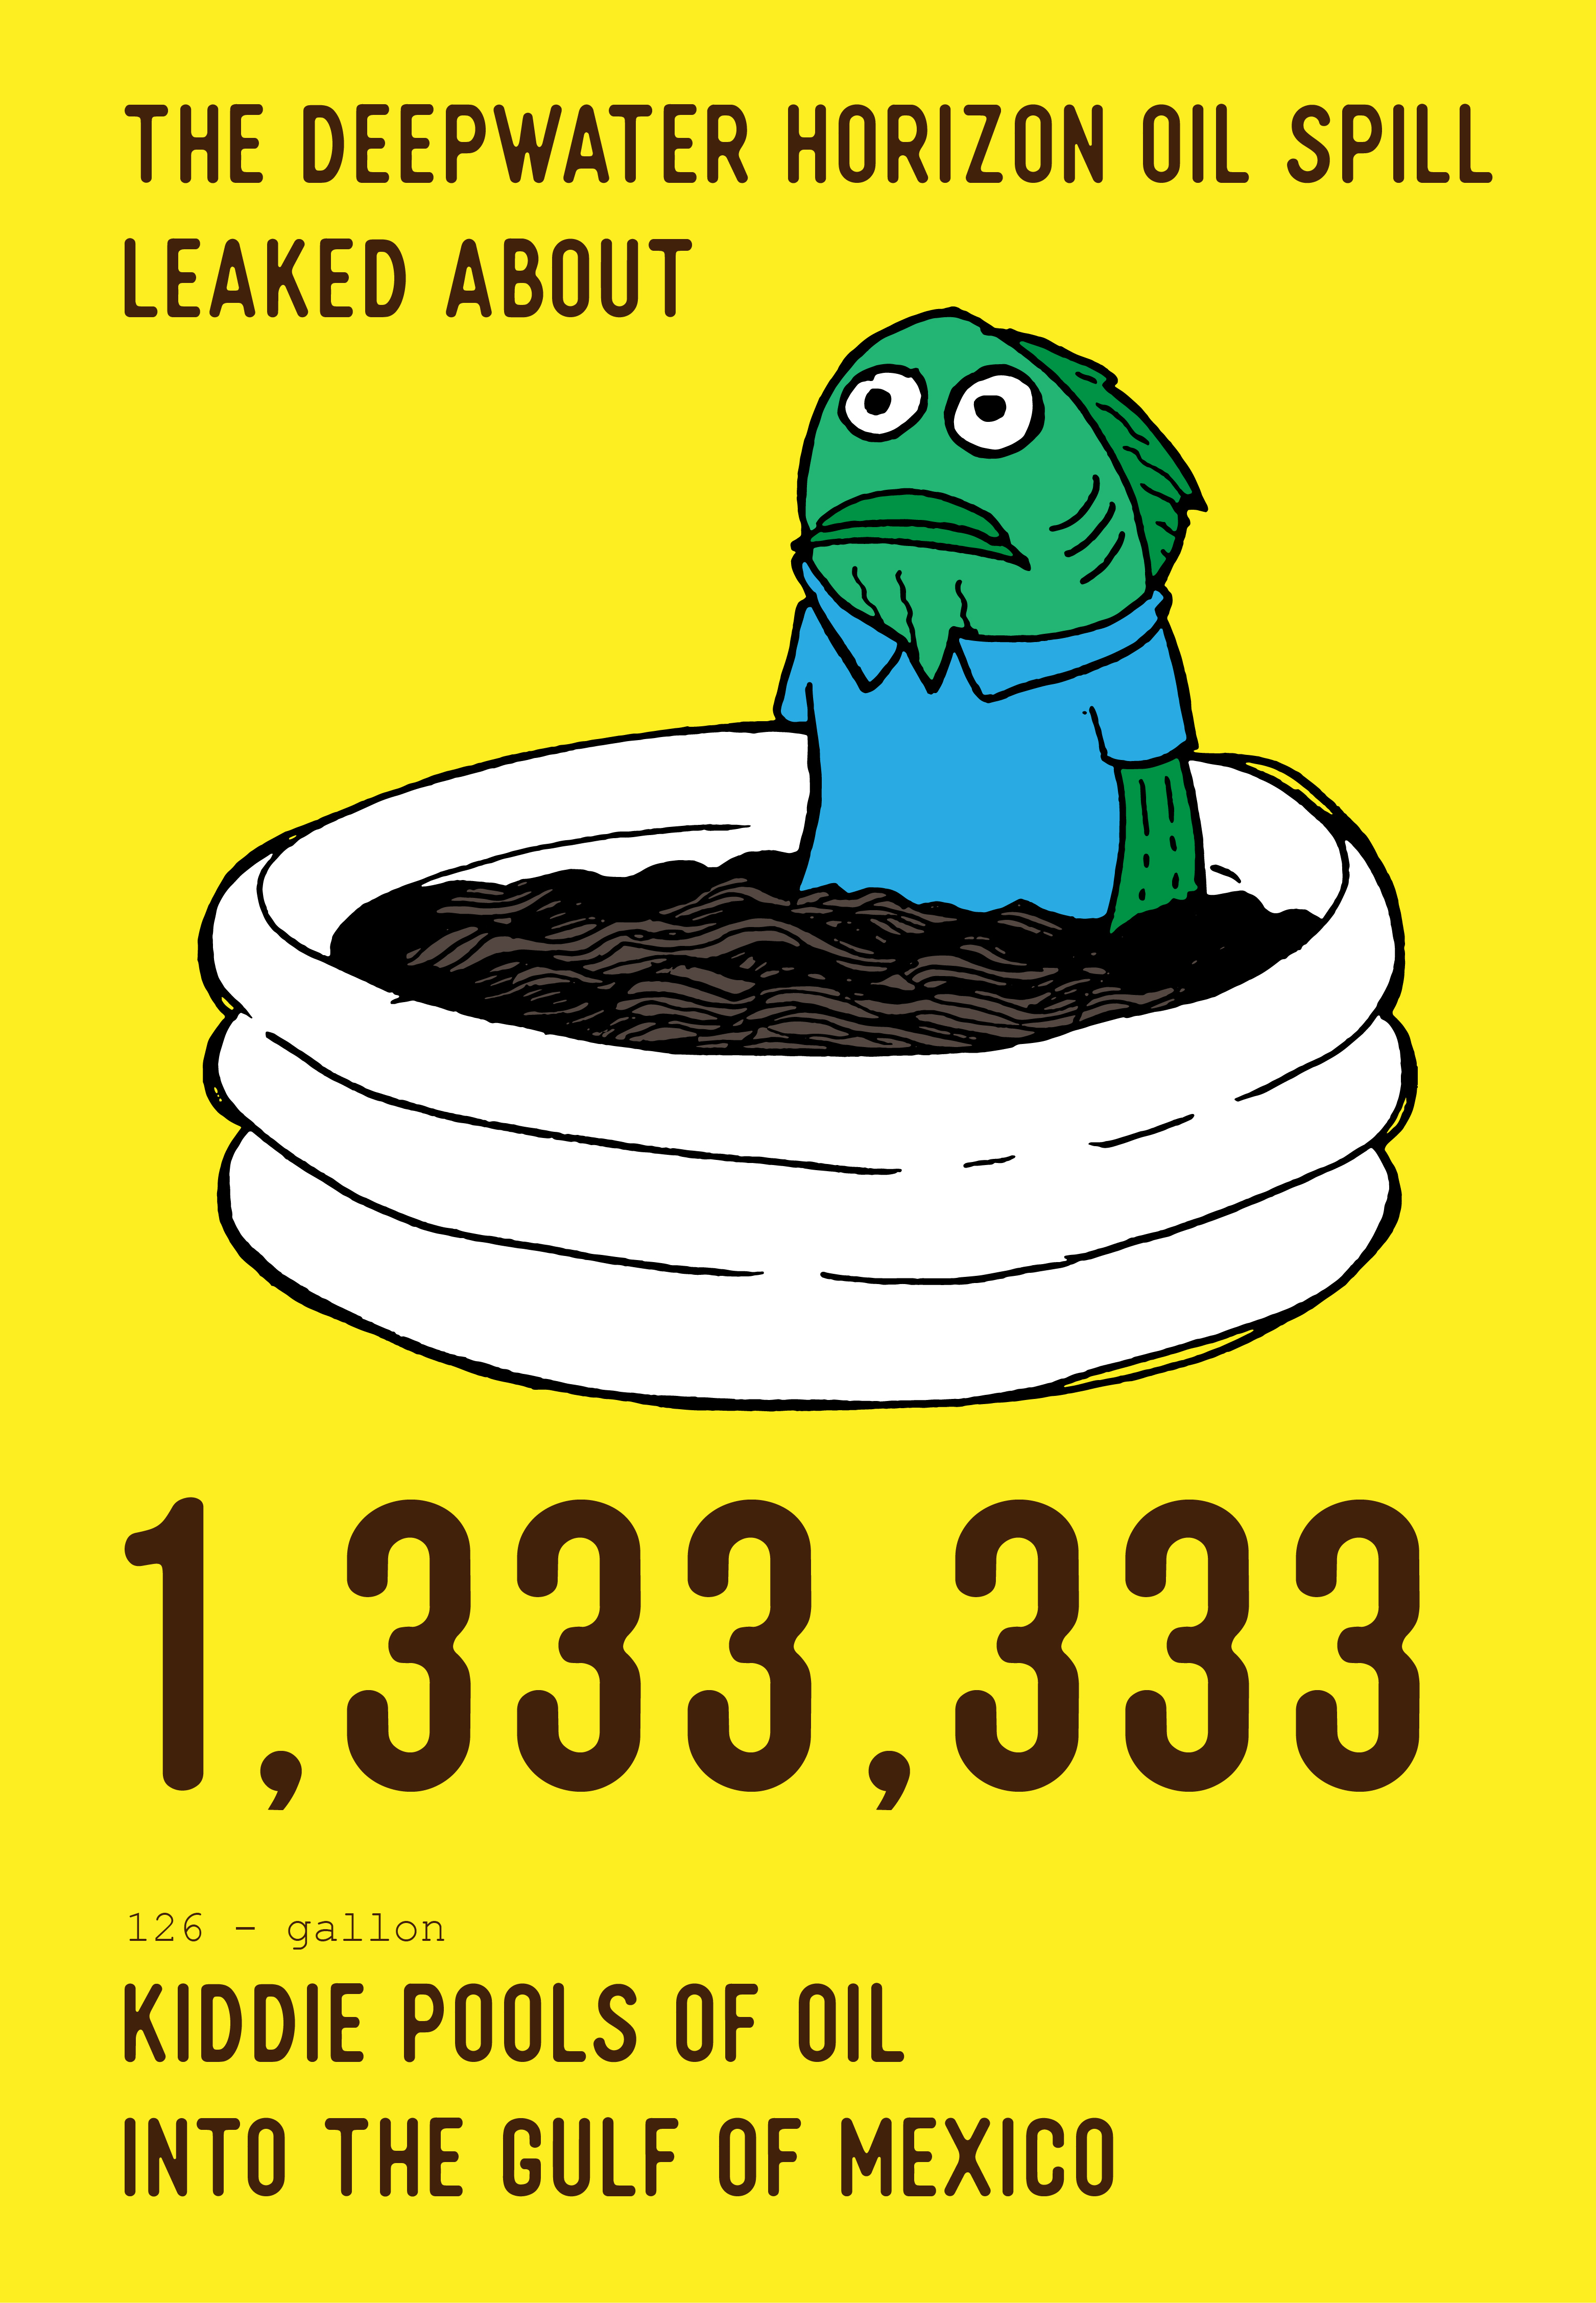
- 17. Spills
-

- 18. Stuffed animals