ENVIRONMENTAL SENSING at
Festival Beach Food Forest
We are using sensors to measure the impact of our land stewardship at Festival Beach Food Forest, a permaculture food forest on a public park in Austin, Texas.
© Cathryn Ploehn
We offer citizen science experiences to the public. Participants collect data, learn about surveying, and observe the embodied reality of permaculture’s impact on the livability of Austin.
What we measure:
- Microclimate
- Air quality
- Soundscape
Contributors
Cathryn Ploehn (point of contact), Grace Park, Carla Leija Garcia, Emma McBride, Aparna Shah, Angelina Alanis, Jenna Jasso, Aly Tharp, Jodi Lane, Shreyas Sudhaman and many more from the Festival Beach Food Forest community.
This project is generously supported by:
- City of Austin Urban Forest Grant
- Planet Texas 2050
- College of Fine Arts Creative Research Grant
- School of Design and Creative Technologies Summer Research Grant


Email cathryn.ploehn[at]utexas.edu for inquiries.
© 2023 - 2025
MEASURING MICROCLIMATE
We are measuring the microclimate (meter to meter changes in weather) inside and outside Festival Beach Food Forest
We are partnering with Keitt Lab at the University of Texas at Austin
Our focus is making sense of rising heat: a threat to ecological and human health that may be mitigated by permaculture stewardship.
Relative to average of 1961-2010 [°F].
© Ed Hawkins (CC-BY-4.0) modified (source)
The experience of high temperatures during a heatwave vastly varies from meter to meter (in other words, between different microclimates) because how we design of our cities and how we steward natural areas.
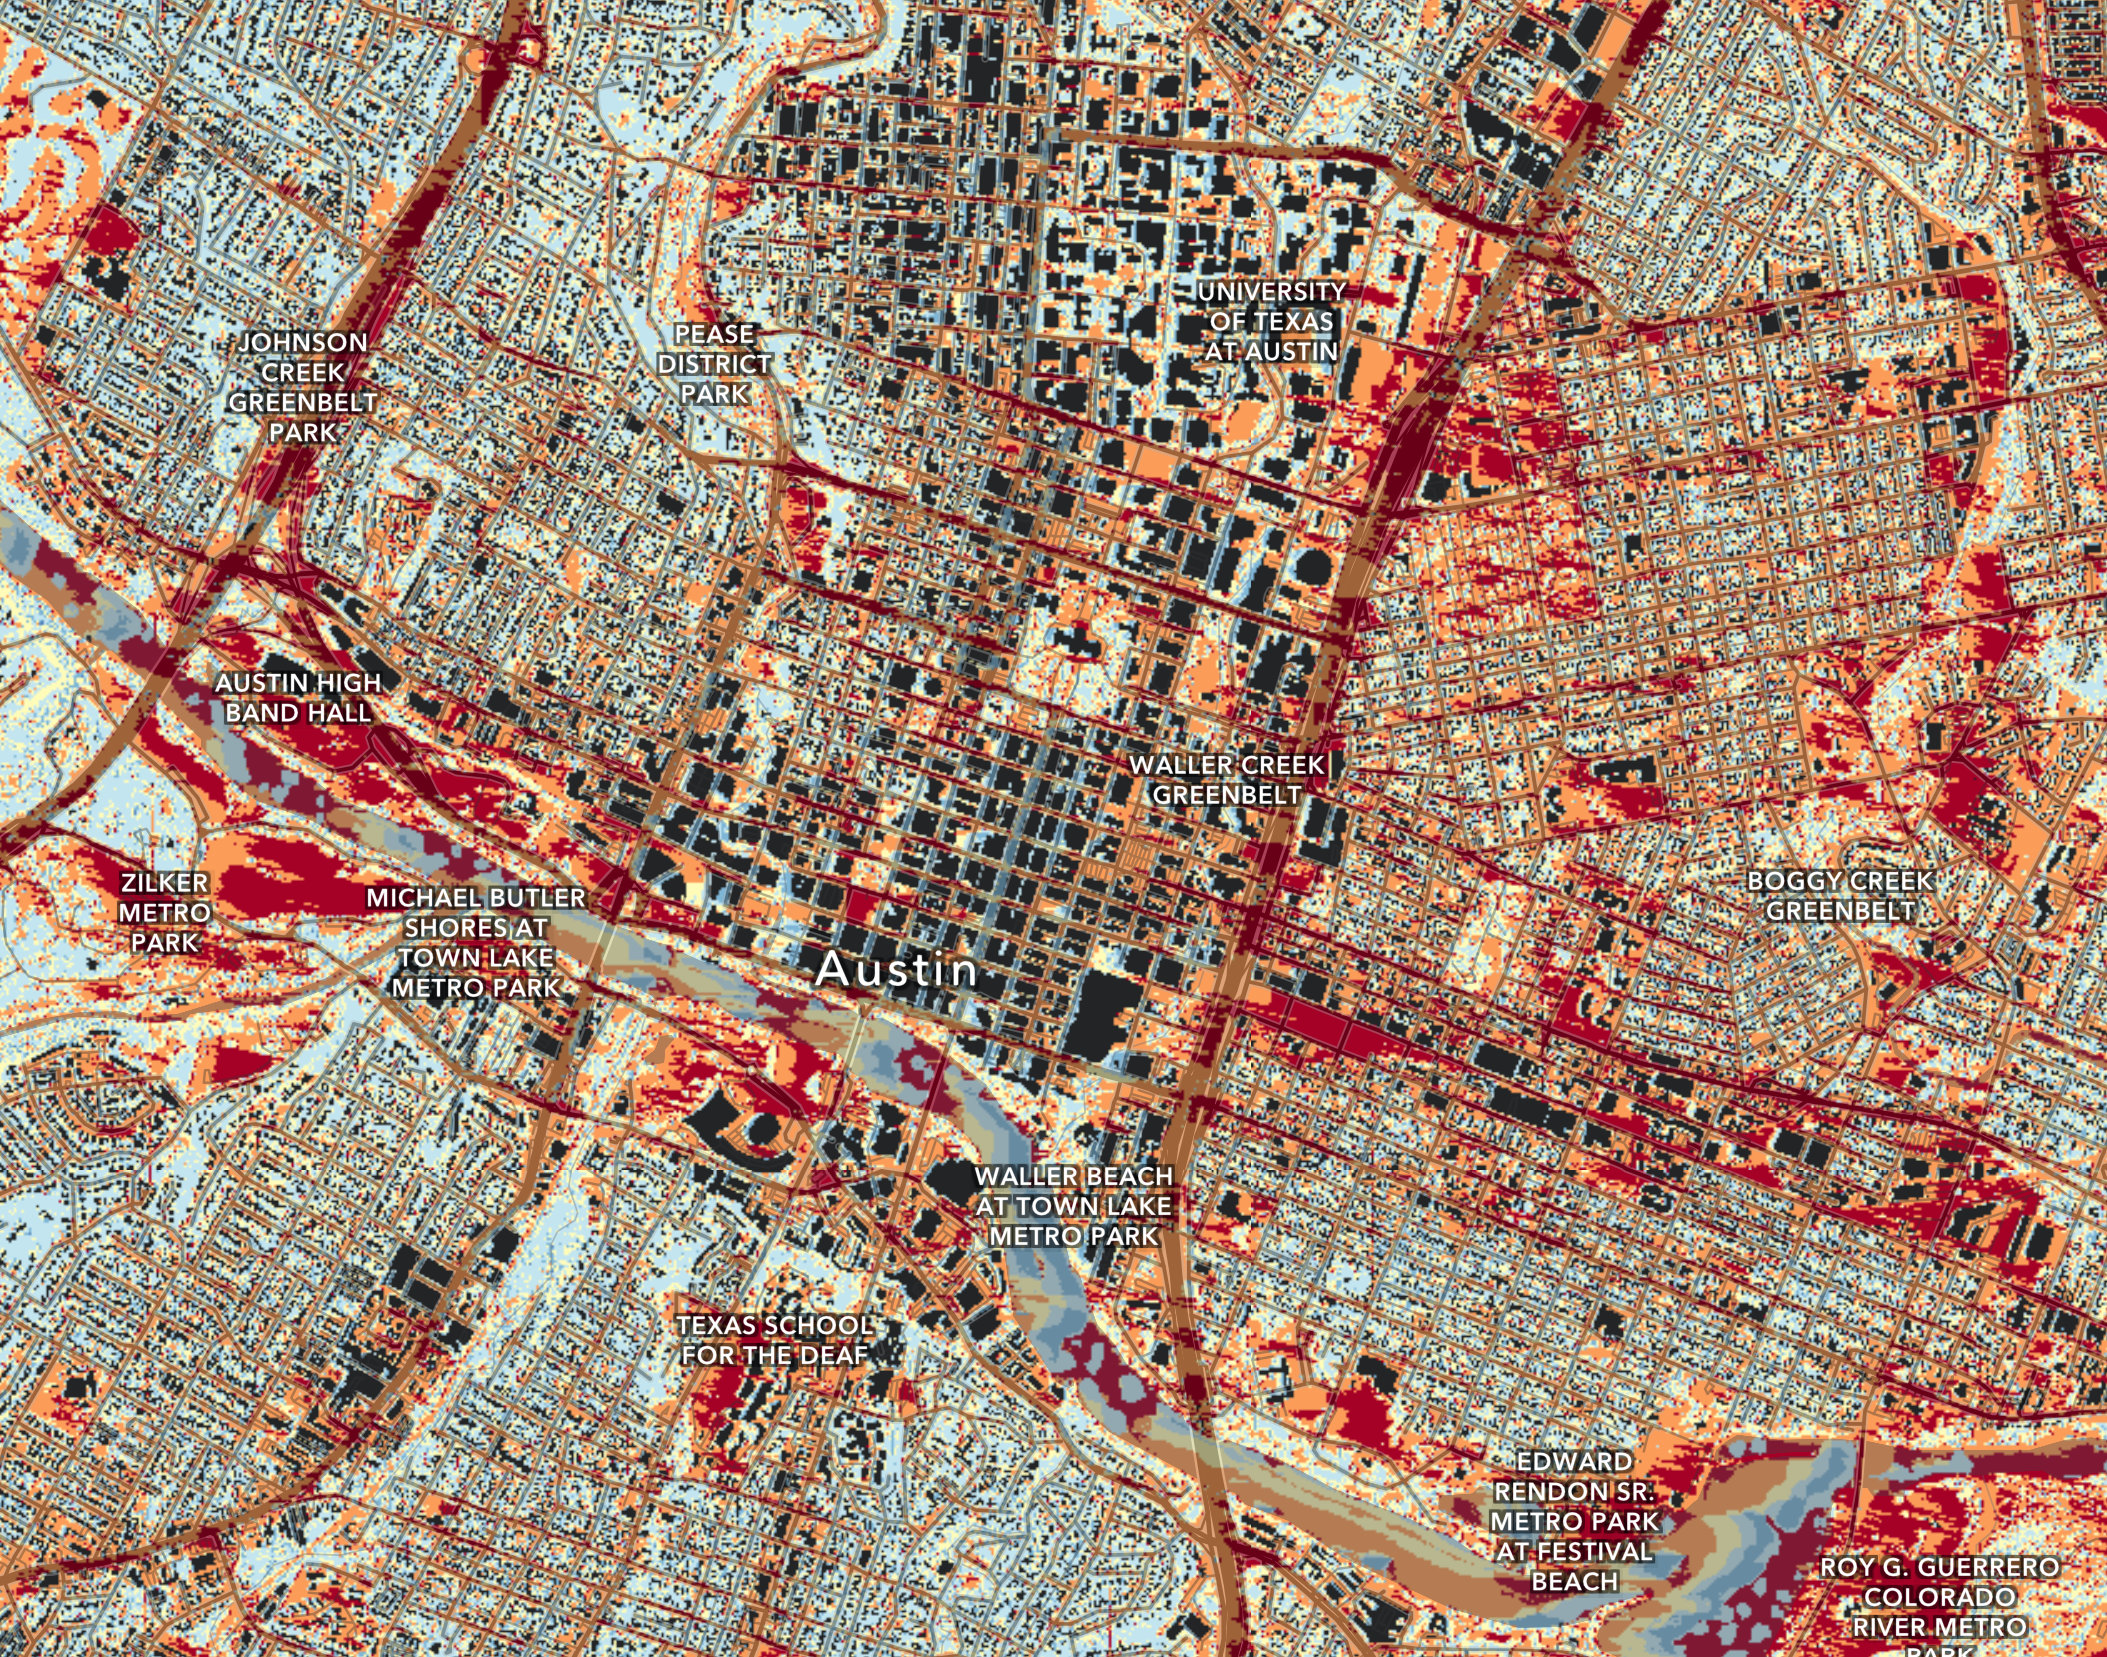
Madeleine Richter-Atkinson, University of Texas at Austin, ATX Climate Atlas (source)
How might Festival Beach Food Forest, a permaculture project with dense plantings, offer critical reprieve in intense Texas heat?
This project aims to determine whether permaculture techniques employed at the food forest (dense plantings, soil building, and multistrata agroforesty) can result in a locally lower heat index (how the body experiences heat) compared to nearby parkland.
For this project, microclimate is defined as "fine-scale climate variations which are, at least temporarily, decoupled from the background atmosphere" [1]
Permaculture designers shape and attend to microclimates
Toby Hemenway in Gaias Garden
Our data may also help food forest volunteers understand and shape microclimates in the food forest.
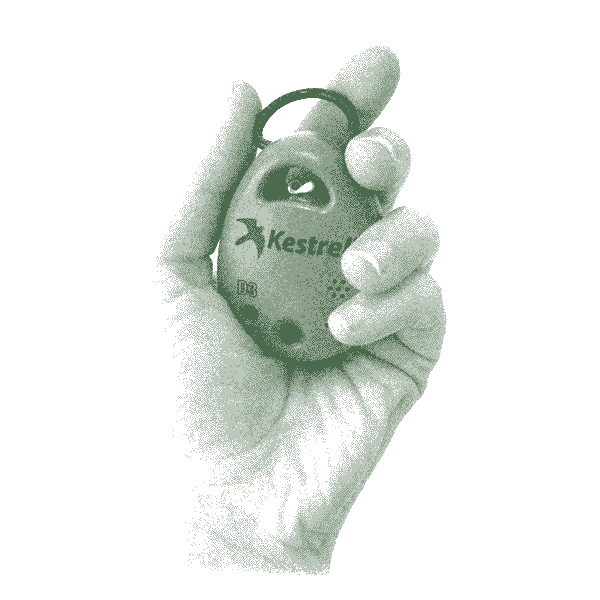
Sensor
We use a Kestrel DROP to continuously measure conditions inside and outside the food forest.
© Cathryn Ploehn
Metrics
We conduct surveys of the below microclimate metrics inside and outside the food forest:
| Temperature | Measure of hotness or coldness [2] |
|---|---|
| Humidity | A moderate degree of wetness in the atmosphere [3] |
| Heat index | What the temperature feels like to the human body when relative humidity is combined with the air temperature [4] |
| Wet bulb | Lowest temperature to which a person or an object can be cooled solely by the evaporation of water, given a constant barometric pressure [5] |
Citizen Science Experience
Our citizen science experience event connects sensor data to sensorial reality of the food forest's impact on landscape.
Group leads guide participants through:
- Collecting data as citizen scientists using sensors
- Exercises for attuning their bodies to the sensorial reality
- Exercises to observe landscape features impacting heat at a small scale
The flow of the participant experience was designed by 2024 Summer Fellows (Carla Leija Garcia, Grace Park, Aparna Shah, and Emma McBride) lead by with Prof. Ploehn
A prototype for a participant experience was developed by Carla Leija Garcia, Grace Park, Isabella Johnson, Channing Lester, Emma McBride during the spring 2024 course Ecological Interaction design, instructed by Prof. Ploehn
The participant experience was built on top of a measurement protocol developed by Prof. Ploehn.
Why design an experience when we can just look at data?
In a city experiencing increasing numbers of heatwaves and other experiential ailments, the design of our built environment matters.
Being directly guided in experiencing (and pondering) the impact of food forest design on the livability of the lanscape is the most profound way to truly know its meaning. Tim Ingold argues that this type of experience confers profound knowledge [6]
In our work, collecting and sharing data about environment matters. However, data is not knowledge:
But information, in itself, is not knowledge, nor do we become any more knowledgeable through its accumulation.
--- Ingold [6]
Understanding the world through data about heat is not the same as being there.
Our knowledgeability consists, rather, in the capacity to situate such information, and understand its meaning, within the context of a direct perceptual engagement with our environments. And we develop this capacity, I contend, by having things shown to us.
--- Ingold [6]
We guide our participants in making legible, or showing, how design impacts the livability of our environments.
Through experience, participants come away with the role of the food forest and silimar multistrata agrogorestry in light of increasing heatwaves.
What we measure
Microclimate
We measure the following metrics, with a focus on how the dense plantings at our food forest impact heat index:
| Temperature | Measure of hotness or coldness [2] |
|---|---|
| Humidity | A moderate degree of wetness in the atmosphere [3] |
| Heat index | What the temperature feels like to the human body when relative humidity is combined with the air temperature [4] |
| Wet bulb | Lowest temperature to which a person or an object can be cooled solely by the evaporation of water, given a constant barometric pressure [5] |
Heat Index classifications (°F):
| 103°-125°F | Danger Heat cramps or heat exhaustion likely, and heat stroke possible. |
|---|---|
| 90°-103°F | Extreme caution Heat stroke, heat cramps, or heat exhaustion possible. |
| 80°-90°F | Caution Fatigue possible. |
Source: NWS Amarillo
We measure microclimate metrics with this sensor:
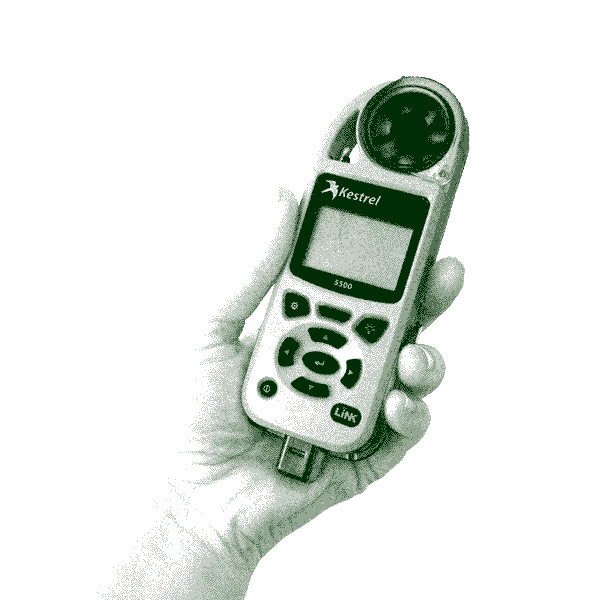
© Cathryn Ploehn
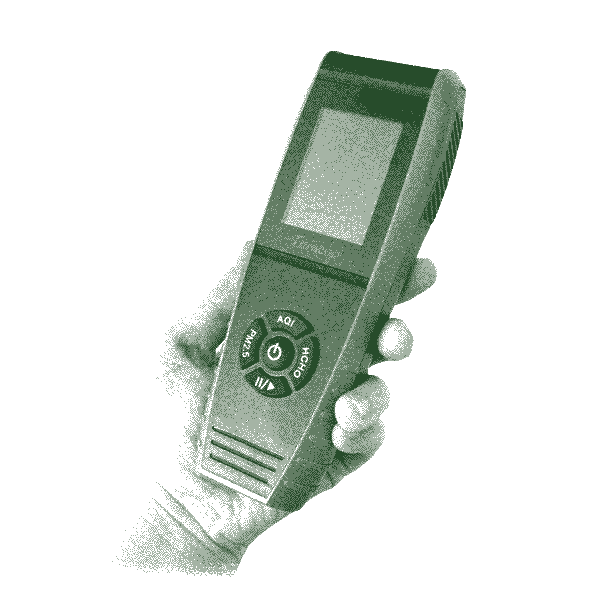
Air quality
Metrics measured:
| PM10 | Inhalable particules with diameters of 10 micrometers and smaller. |
|---|---|
| PM2.5 | Fine inhalable particles with diameters of 2.5 micrometers and smaller. |
| Air Quality Index (AQI) | How clean or polluted the outdoor air quality is. |
Air Quality Index (AQI) classifications:
| 301+ | Hazardous Health warning or emergency conditions. |
|---|---|
| 201-300 | Very unhealthy Risk of health effects is increased for everyone. |
| 151-200 | Unhealthy Members of the general public may experience health effects. |
| 101-150 | Unhealthy for sensitive groups. |
| 51-100 | Moderate Risk for those unusually sensitive to air pollution |
Source: AirNow.gov, accessed Summer 2024
Sensor:
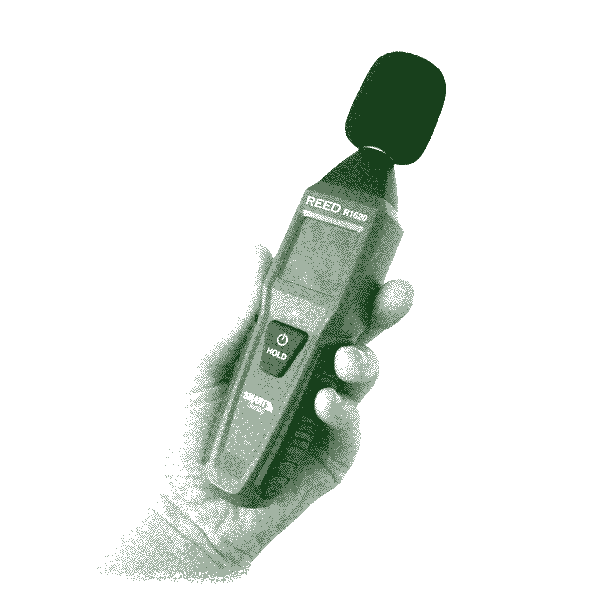
Sound
We're still developing a procedure for observing and qualifying sound data.
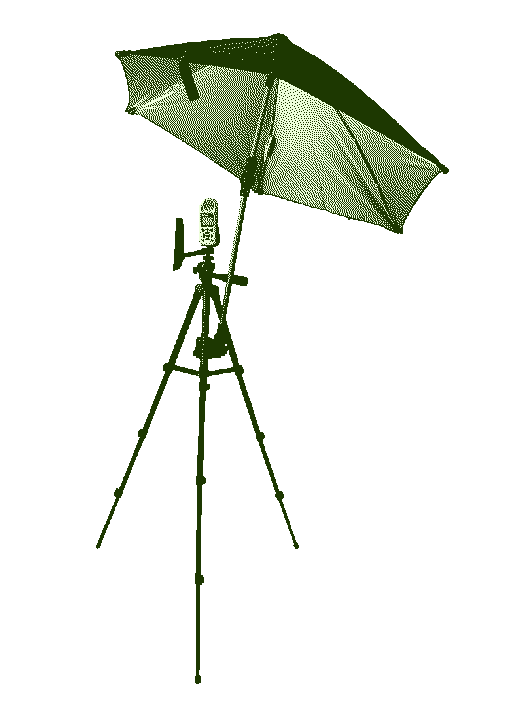
Sensor setup
We attach our sensors to a camera tripod and use a sun shade to protect them.
How we observe
Landscape features
We guide participants through the following landscape features that contribute to microclimate:
| cooler <-------------------> hotter | |
| Infrastructure | impervious <---------------> porous Vehicles and buildings emit waste heat. Dry, hard materials (like concrete) absorb and re-emit more solar energy. |
| Vegetation | dense <--------------------> barren Plants release water through transpiration, removing heat from the air. |
| Density | open <---------------------> crowded Open land allows heat to disperse, while obstructions like buildings trap heat. |
| Shade | none <---------------------> full Shaded areas where solar energy is blocked feel cooler than areas in direct sunlight. |
Survey locations
We guide participant groups through the following locations. The locations were chosen because they represent the broadest range of landscape features in the immediate area.

Run of show
Guidebook
Participants receive a workbook to guide them through the experience.
Original guidebook design by Summer 2024 fellows Carla Leija Garcia, Grace Park, and Aparna Shah. Current iteration with some modifications by Cathryn Ploehn
Group leads also have a guidebook to aid in running the event.
Invasive grass paper
Summer fellow Emma McBride developed a process for making paper out of Bermuda grass, an invasive grass continuously weeded from the food forest.
We aim to incorporate this paper into the guide book creation process.
At each location
Participants do the following at each location:
-
Set up sensor
Group leads make sure the sensor is set up properly.
-
Body scan

Participants prompted to tune in to how their bodies feel at the location
They write down any observations.
-
Observe landscape features

Participants write down which landscape features they see.
-
Guess the temperature

Participants make a guess on each metric.
Then, sensor data is revealed.
Reflecting
Participants reconvene to share data and reflect on the experience
-
Compiling all data

Each group writes down data on a big poster
-
Reflection
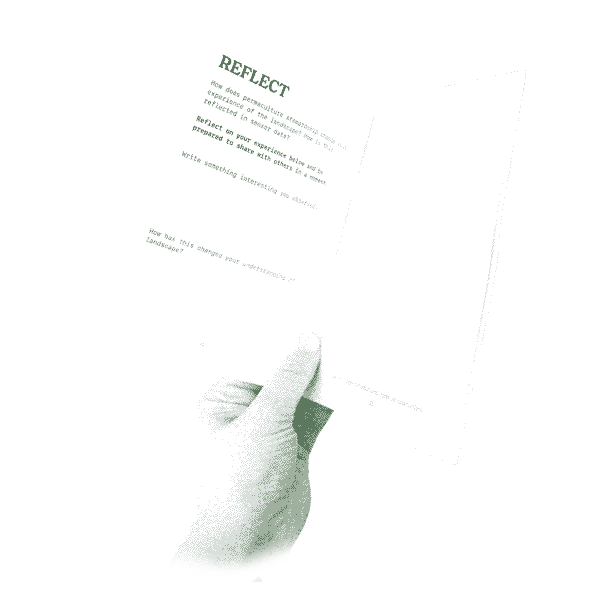
Participants write reflections on their experience and discuss in small groups.
Example data
During a citizen science event on June 8th, 2024, we collected the below data (at 5:55pm).
On that day, the pecan circle, the central meeting place of the food forest, is about 4 degrees cooler than park land (survey location phase 2, which is site of future food forest development).
Meanwhile, the northern entrance (where the sidewalk meets the entrance of the food forest) is almost 9 degrees hotter than the pecan circle.
Summer 2024 Fellowship
In the Summer of 2024, Cathryn Ploehn and four fellows to developed and conducted a pilot Citizen Science Experience focused on observing heat. Students produced the majority of materials for this experience.
The fellows were:
- Grace Park
- Carla Leija Garcia
- Emma McBride
- Aparna Shah
Students created an observational protocol to underline the embodied reality of data collection. Students began this work in their Spring 2024 Ecological Interaction Design studio course (also taught by Ploehn).
Invasive grass paper workshop
Summer fellow Emma McBride developed a process for making paper out of Bermuda grass, an invasive grass continuously weeded from the food forest.
We ran a workshop with food forest members to demonstrate the process.
Sources cited
- I. Bramer et al., “Chapter Three - Advances in Monitoring and Modelling Climate at Ecologically Relevant Scales,” in Advances in Ecological Research, D. A. Bohan, A. J. Dumbrell, G. Woodward, and M. Jackson, Eds., in Next Generation Biomonitoring: Part 1, vol. 58. Academic Press, 2018, pp. 101–161. doi: 10.1016/bs.aecr.2017.12.005.
- “Temperature | Definition, Scales, Units, & Facts | Britannica,” Jun. 19, 2024. Available: https://www.britannica.com/science/temperature. [Accessed: Aug. 09, 2024]
- “Definition of HUMIDITY,” Aug. 08, 2024. Available: https://www.merriam-webster.com/dictionary/humidity. [Accessed: Aug. 09, 2024]
- N. US Department of Commerce, “What is the heat index?” Available: https://www.weather.gov/ama/heatindex. [Accessed: Aug. 09, 2024]
- “Wet-bulb temperature | Description, Uses, Climate Change, & Facts | Britannica.” Available: https://www.britannica.com/science/wet-bulb-temperature. [Accessed: Aug. 09, 2024]
- Ingold, Tim. The Perception of the Environment: Essays on Livelihood, Dwelling and Skill. 1st ed., Routledge, 2021. DOI.org (Crossref), https://doi.org/10.4324/9781003196662.